

Sample Testing When We Don’t Know The Population Standard Deviation
Its all well and good sample testing when we know the population standard deviation. But what about if we don’t have the ability to get production data, or we just have a small sample size? How to conduct sample testing when we don’t know the population standard deviation.
Z-Score
So in our previous example, we conducted our hypothesis testing on our Z score.
The thing with this calculation. It’s only accurate when we use it on sample sizes that are above 30 and we know certain details about the main population data.
As described here: Calculating Hypothesis Test Statistics
But if we don’t have that population data?
We have to use another calculation called a one-sample T-test.
It all works in a similar way, but I want to explain how we can test in isolation when we have a very limited sample number.
Sample testing is more accurate when we have a larger sample size.
It more accurately predicts population data the larger the sample size is.
Until ultimately you get to the full population and you have a sample size that’s the same size as the population data.
But we spoke why this can be unobtainable here: The Importance of sample size
T-Score
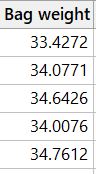
Now from this small sample of data above, you would be quite happy to accept that all bags are above the threshold of 32.51g, the mean is a value of 34.18g.
But that’s not the full story.
We need to conduct the equation:
T = (X – μ) / [ s/√(n) ]
- s is the standard deviation of the sample
Which on the above data gives us a P-value of (with our hypothesis threshold of 32.51g) of 0.001. Which as we know is a very low P-value. If the P is low, the null must go.
Even with this very small sample size, we must reject the null hypothesis.
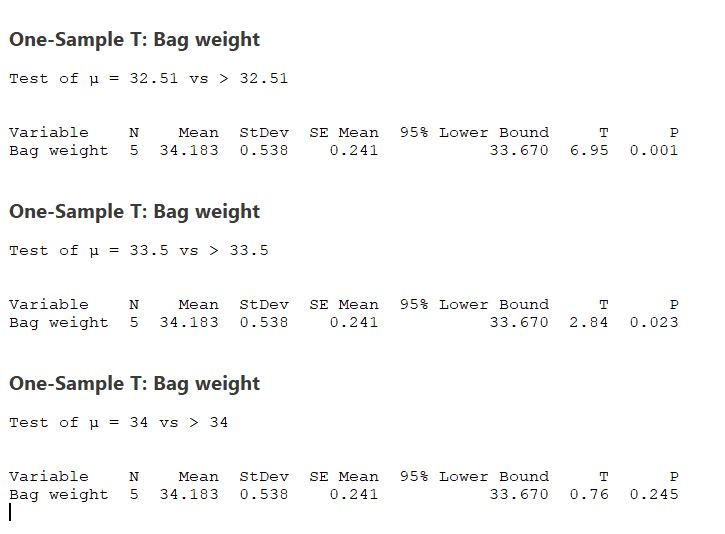
And as you can see from the above, it’s only really when we start increasing our hypothesised mean that we really start to get to a point where we can fail to reject our null hypothesis.
In a real-world scenario, we would go back and request more data if we had a lot riding on this.
However, the above proves that we can use very small sample sizes to either reject or fail to reject the null hypothesis’ when sample testing.
Conclusion
I said before in a previous example of some statistical geekiness not to worry too much about understanding all this information in its entirety. There are some great software tools that do all the above calculations really quickly. Even Microsoft Excel can do these calculations.
If you want any advice on sample testing, or indeed you want us to have a look at any of your samples please get in touch here, or connect with us on LinkedIn here and follow Merchsprout here.