

Have you ever had a problem where you just don’t know where to start? Sat there, head-scratching, not knowing which way to look? Well, if that’s ever been you in any environment, then grab yourself a coffee and have a read on here: How to measure problems in Chinese manufacturing?
This is the third post in a series of blog posts discussing issue resolution using the Six Sigma toolset; DMFEA.
In our previous blog post, we discussed how to define an issue. You can read it here;
How To Define A Problem In Manufacturing Environments?
How big?
We have always been taught that everyone loves a big one… Right?
When it comes to issue resolution big ones and little ones are sometimes equally hard to find.
Regardless of the size, we need to understand how far away from the target we are.
Why?
Well, we want to have a measurable baseline pre-project. We want to understand how bad and how widespread the issue is.
Wherefrom though?
There are a number of tactics that can be employed to measure the issue is, this has to be from data.
It can be VOC (voice of the customer) or general complaint data.
We want to get the granularity of what is the problem with Y in Y=f(X) is.
Measuring the data
Before we can spend any time analysing we need to develop a data collection plan:
Step 1. Develop a data collection phase
Step 2. Map relevant processes
Step 3. Validate measurement systems
Step 4. Measure how bad the problem is
Step 1: Develop Data Collection Phase
This phase can be costly and time-consuming. We need to ask ourselves basic questions as to WHY.
We need specific questions regarding the Y, how we want the answers displayed and what tools are needed to gain them.
Additionally, we want to know what type of data that is and how much is required, and where that data will come from.
From this we want the outcomes:
- How bad is the problem?
- How widespread?
- Is it equally bad across everywhere?
- Are some areas worse than others?
- Is it limited to just one function?
Types of Data and graphs
We have 2 types of data that we can use to measure our problem.
- Continuous
- Discrete
Knowing which of these 2 data inputs will allow us to know which graphs we can utilise to visualise our issues.
Continuous Data
Continuous data is derived from a value on a continuum.
- Inches
- Cm
- Pounds
- Kg
- Decimals or fractions
- etc..
When we are provided with the above data we can use:
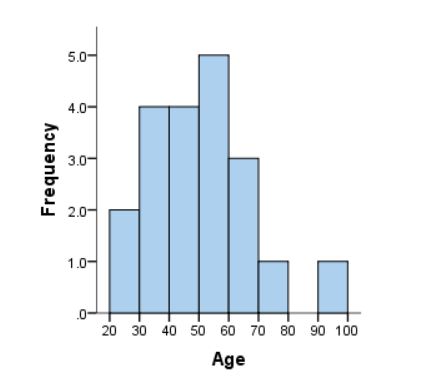
Histograms
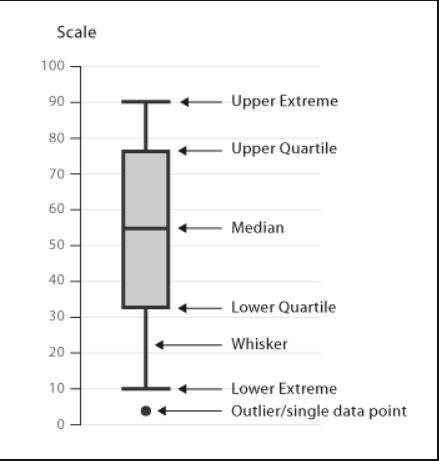
Box plots
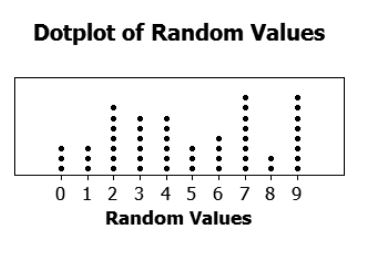
Dot plots
To visualise the data provided. These data sets show the variation and how spread out they are.
Discrete Data
When we are provided with discrete data we are given values such as integers or whole numbers.
This can be data such as number of people in a queue or the number of components that we have in a scrap bin after a failed quality control audit.
Proportions can be generated from this data, for example, we had 30 out of 100 a batch of components fail the end of line test due to radius 4 on a drawing being out of specification.
For this sort of data we can use categorical data charts:
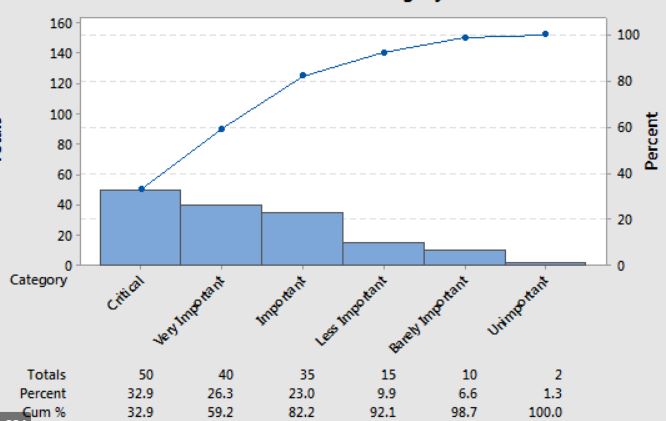
Bar chart and Pareto
Graphs showing trends over time are also used:
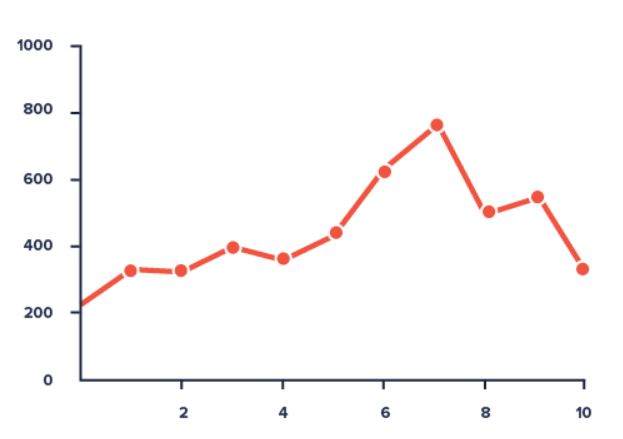
Line graphs
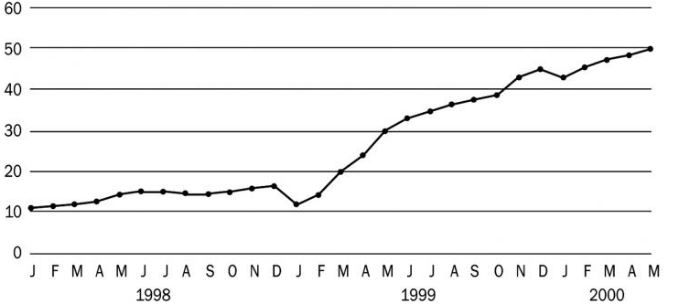
Time-series chart
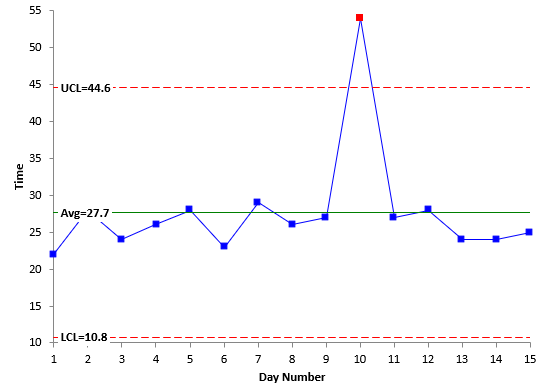
Control chart
Step 2: Map the relevant processes
This is conducted to ensure you know where to collect the data and to understand the activities to collect the data.
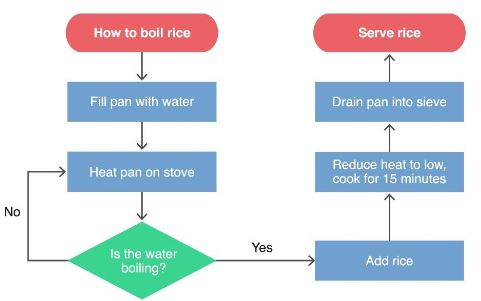
This is a visual representation of the steps that take place from start to finish.
We discussed how to map a manufacturing flow chart here:
How To Successfully Map Processes In Chinese Manufacturing
Symbols in a Process Map
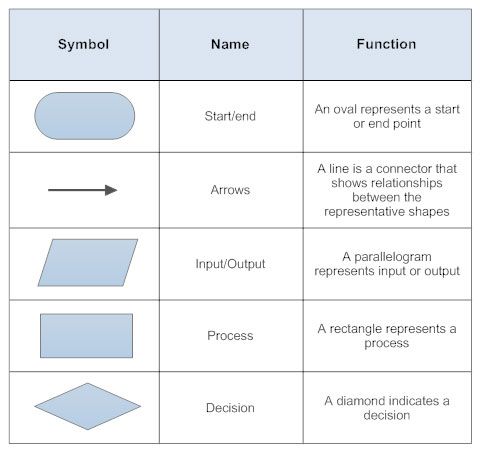
Process maps run from top to bottom or left to right.
A process map is beneficial as it takes a snapshot in time to show the team what is, or is not happening.
It will help you understand where in the process were to collect data, analyse further, or where bottlenecks are.
Mapping a current process
It’s important that you involve people who know the process here. Decide on a start and endpoint and use logical flow.
Walk the line with the flow chart and don’t analyse the process.
Don’t try and fix anything at this point. Just document what you see.
Step 4: Measure how bad the problem is
The final step in the measure phase, we look at how bad the problem is when compared to requirements, specification or targets.
We measure the Y in Y=f(x).
Measurement System Analysis
To ensure that we have captured the data correctly we want to use a system called MSA.
This is conducted early on in the measurement phase to ensure that any data collected is valid.
It includes all measure systems in the processes, including; instruments, operators and procedures.
Measurements need to be accurate with no bias, repeatable and reproducible. The equipment calibrated and should get the same readings repeatedly.
A good way to gauge this is to ensure you get the same reading off different devices.
How to conduct MSA
20-25 known items should be tested and measured by at least twice by two different operators, this is called a blind test.
Any inaccuracy in repeatability or reproduction issues are rectified here.
MSA is repeated to ensure that any issues that were found are fixed.
MSA must be conducted before any data is collected or used. Both types of data are applicable;
The process capability and sigma level
Process capability is how well a process performs against its target specifications it’s also how capable the process is in meeting those specifications.
The process capability enables you to understand baseline performance in terms of process capability.
It allows you to know how often how well or how bad performance meets specification.
The main benefit being improvements can be now measured at the end of a project to ensure that improvements have been made.
The process capability also encompasses the sigma level when discussing capability and repeatability.
However, we will discuss the sigma level in greater detail in a later blog post.
Do You Need Help Finding That Needle In The Haystack?
The only 100% sure-fire way to ensure you are dealing with quality in Chinese factories is to have someone on the ground, on your side. Batting for your team. A team player who not only knows how to capture and report out but a player that can hold those suppliers to account in the event of quality issues.
Here at Merchsprout, we do just that, we offer you the ability to save time and money by doing the hard work for you. We offer several services that allow you to remotely oversee operations.
If you want to learn more about how we do what we do and the services we offer, have a look here.
Source Chinese Products Without Going China
If you want to just get in touch, we are a friendly bunch and honestly just like hearing from you. Contact us below, leave a comment or connect with us on Linked In.
Dealing Remotely Is Very Much A Possibility, Have The Right Team Members On Your Side
Source Chinese Products Without Going to China is not only a possibility it’s relatively easy when you have the right team on your side. We are the right team for Sourcing, Auditing and Quality control.