

It’s an interesting concept; analysis. How often is it that we over, or under analyse something. We procrastinate, look too deeply or don’t look at an item at all. Sometimes you can be staring an issue in the face yet still not see the problem? Ever felt like this? If so, have a read on; let’s see how to analyse problems in manufacturing settings.
Don’t worry though, if you want to analyse any problem, the toolsets we discuss here can be transferred into all environments.
Here at Merchsprout, we spend our days analysing things. Be it the quotations received or the latest manufacturing site to audit.
Analysing things is what we do.
However, analysis is only one step in a whole host of skills which need to be employed when the issue is not known or understood.
This is the fourth blog post on the subject of using Six Sigma tools to get to the root of an issue. In this stage, we look into the A in DMAIC.
You can read our previous blog post here:
How To Measure Problems In Chinese Manufacturing?
Analyse
The analysis stage in DMAIC is where we study the data we have gained from previous steps. We define the factors (remember the f) impacting performance and diagnose which factors impact Y.
Why is there a problem and what are the steps to organise?
- List potential X’s that impact Y
- Organise the potential X’s
- Shortlist and select the key X’s
- Develop the data collection plan for the analysis
- Prove the key X’s in y=f(x)
Let’s look at what we do here at Merchsprout:
Step 1: List
Brainstorming is crucial; we get the team together and thrash out those potential X’s. Anything gets thrown in the mix here. I would like to say here that when we first started doing this exercise with the team it was refreshing being in an environment with a diverse skill set. Those out of the box ideas allow us to diversify ideas I cannot stress enough the importance of having team members that really stretch your thought process.
A list as long as possible is developed.
Step 2: Organise potential X’s
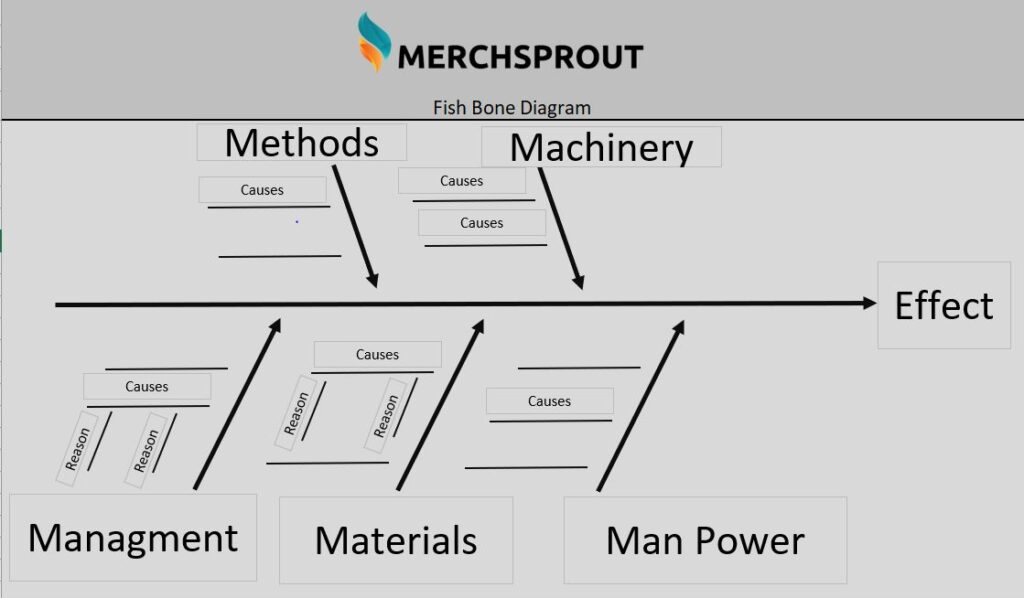
What’s a cause and effect diagram?
This is an organised list of potential causes on a particular effect. It’s sometimes known as Ishikawa or a fishbone diagram. I have to admit something here. When I was working in engineering in a manufacturing environment, I used to hate doing fishbone diagrams. Looking back I fully understand why. I didn’t have the data nor the people around me to assist with the construction of it.
Top tip: ensure you have a strong team here, that know the process.
A fishbone diagram should capture all possible X’s. Remember BIIIIIIG fish.
From the fishbone, the most likely X’s should be able to be selected and highlighted as tests to validate effect upon the issue.
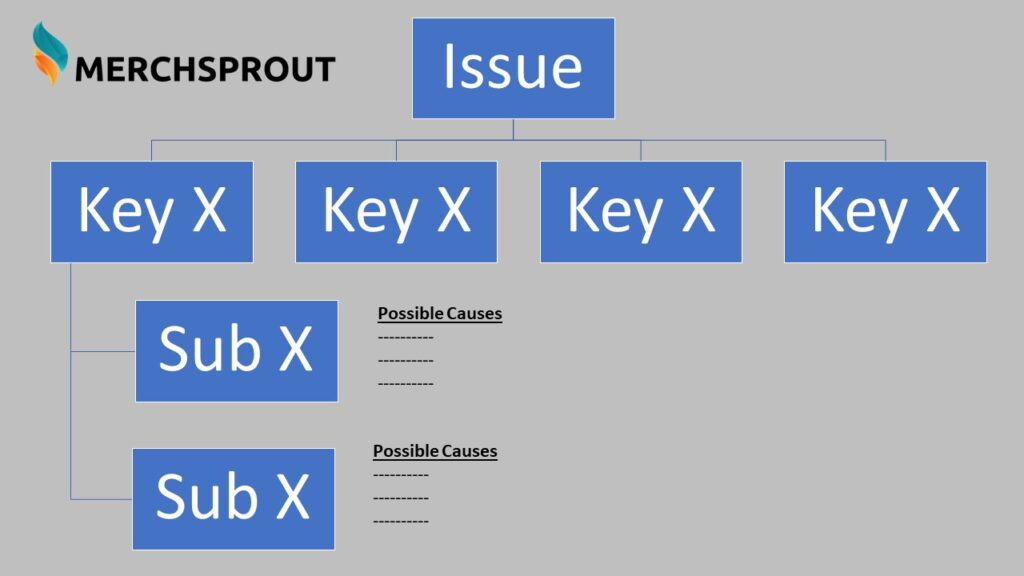
We also utilise Tree diagrams:
Step 3. Shortlist and Select the data
We utilise the strength of the team here, we nail down the factors that are impacting the X’s. List them out interrogate and discuss.
Step 4. Develop the data collection plan
Before collecting any data we need to plan, let’s ask WHY, why is it needed. So that the correct amount and type of data is collected.
So how do we collect that data?
Of course, with any scientific hypothesis, we start by asking questions. What are we to test? What is the type of hypothesis to test and use? Which data is needed, how much of that data, where from and who shall gather it?
Data collection plans should be laid out in a table. The questions on the top with each X along the side.
The plan for collecting data in the analyse phase is important. It allows for the project team to know, not only which hypothesis to test but what, how much and from where the data will come from.
Step 5. Prove the key X’s in Y=f(x)
Now we have our key x’s assessed and the data around them understood. Its time to prove them out. We use Inferential statistics, Hypothesis tests and then use robust validated testing to verify the key x-factors.
How to conduct Hypothesis Tests
To hypothesise we need to use scientific methods. A theory is proposed, then data and evidence collected, to dismiss or support the proposals. If the theory is not supported by the evidence, the theory is therefore disproven. If supported, it is validated.
Run through the key X’s from the fishbone or tree chart and apply the hypothesis tests.
Remember, validate potential key X’s with DATA and FACTS.
Do You Need Help Finding That Needle In The Haystack?
The only 100% sure-fire way to ensure you are dealing with quality in Chinese factories is to have someone on the ground, on your side. Batting for your team. A team player who not only knows how to capture and report out but a player that can hold those suppliers to account in the event of quality issues.
Here at Merchsprout, we do just that, we offer you the ability to save time and money by doing the hard work for you. We offer several services that allow you to remotely oversee operations.
If you want to learn more about how we do what we do and the services we offer, have a look here.
Source Chinese Products Without Going China
If you want to just get in touch, we are a friendly bunch and honestly just like hearing from you. Contact us below, or leave a comment.
Dealing Remotely Is Very Much A Possibility, Have The Right Team Members On Your Side
Source Chinese Products Without Going to China is not only a possibility it’s relatively easy when you have the right team on your side. We are the right team for Sourcing, Auditing and Quality control.