

How Engineering Quality Can Improve Your Quality Of Life
A strange title for this series of blogs I agree. But bear with me. Really, let’s talk about How Engineering Quality can Improve your Quality of Life. How I implemented some simple quality tools to improve my quality of life considerably.
There is a reason why planes don’t fall out of the sky due to their wings falling off or when driving down the road cars don’t spontaneously combust.
Aeronautical and automotive components; through frequent testing, continuous monitoring and the implementation of control systems, maintain an exceptionally high degree of quality; meaning that it’s no lottery taking a flight or driving a car.
Ok, you have probably been in a car that has broken down or failed to start. Indeed there have been instances; even recently, where planes have fallen out of the sky (737 Max).
But the vast majority of cases, you go to your car in the morning; it starts, it continues to run, and it gets you home safely. Additionally, you can fly to locations knowing that in the vast majority of cases you will land without issue.
It wasn’t always the case. For decades (the 50’s, 60’s and 70’s) it was a gamble if your car started first time in the morning. It’s one of the reasons why Datsun and similar Japanese car manufacturers were able to sell so many vehicles in the 1970s in markets like the UK. At utter bemusement to the domestic car manufacturers.
The reason? Their cars just worked.
They did it through the improvement of quality using some effortless quality tools.
Using continuous improvement, they improved the lives of their customers.
That’s a real pain point.
I am going to show you how you too can improve your quality of life by using some simple quality tools and hopefully improve it as much as the Japanese improved their cars through the 1960s and 1970s.
If you cannot measure it, you can not change it.
If you cannot measure something; or more importantly if you can not record the current value of something, you cannot change it accurately in the direction of success.
Let’s take dieting as an example.
Oh shit, we are going deep quickly.
Look, dieting and weight is probably the biggest single reason for having a low quality of life (possibly second to monetary worries).
When you are dieting, you *should* be tracking your weight or size, if not how will you know what you are doing is taking effect. I am not going to teach you anything new here, this is not rocket science, but it is a great way to improve some fundamental principles.
Believe it or not, control and monitoring is an excellent tool in the quality world too. We measure components and track them against an acceptable level. Let me explain this in a graphical format below.
Being an engineer, I love a useful graph!
The above graph is looking at the variation of a value and showing where in the Goldilocks zone, it falls.
An upper and lower control limit are the limits for the Goldilocks zone. The zone, where if the values fall consistently, state the process is under control.
When values fall outside of this Goldilocks zone, the process is out of control; the process requires modification. As sample 11 is in the above chart.
So bear with me here, if we take our above example of weight loss and we know that we; let’s say for argument’s sake, want to lose 0.6kg a week of our total body weight, then we would track this in a graph like this:
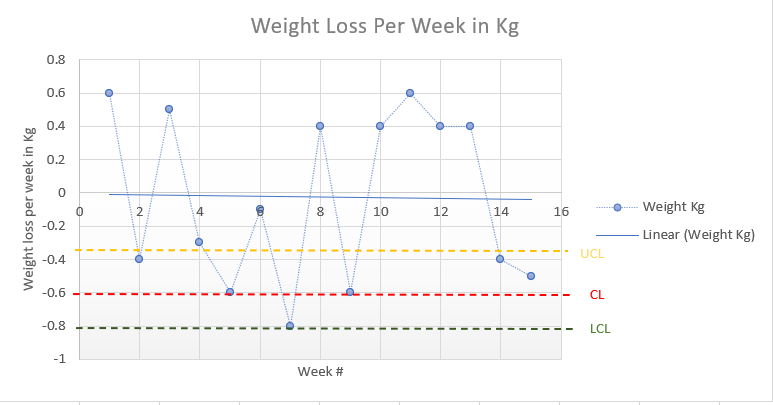
Only 6 of our 15 weeks are falling within our upper and lower control limits, showing, in an exact graphical format, that our weight loss process is out of control. Even though we may be dieting, and we are losing weight (loss over the 15 weeks of a value of 0.4kg) the loss has been erratic; it’s not been in control.
It’s easy to state that something is out of control when the accuser is basing their assessment on a situation that’s subjectively assessed.
But using data presented with upper and lower control limits, we can accurately determine if indeed the process is in, or out of, control. Using data in the above way is objectively assessing the situation.
I know this may seem a bit over the top, but the simple existence of control and a control plan is the best way to manage any situation in life, actively.
It took a long time to understand what happiness means
So why would this simple tool allow you to improve anything in life?
Because you can attribute data to anything, you too can start to monitor and improve things. Whether it be your bank account ingoings and outgoings, there is a way to record it. Even if its something that you need to attribute a subjective assessment to, let’s say a feeling of happiness, you can attach data to it.
Ok, so after some simple training of yourself by you, you can start to give a 1–10 value based on your happiness value of the day.
Put it into a spreadsheet daily, and then have a look at the external factors why you may have felt like that then. You can then start to visually see when, where and why you think this way. Maybe it was a feeling of dread because you have a bill go out of the bank that left you too close to comfort, or that you were around someone that you, for one reason or another made you feel happy or sad.
It’s all data, and because its data, if monitored and recorded, we can change it.
Sign up for our newsletter to get stories directly into your inbox. Follow us on Linked In here and be sure to check us out on Medium.
And get titles straight into your inbox here.