

Deciding the correct Hypothesis:
In our previous post, we talked a lot about crisps. Walkers crips in fact. I would not recommend eating crisps, far too much salt, carbs and fat.
But on a hot day, sitting in a beer garden, alongside a canal, the sun radiating down, there is nothing better than eating a nice bag of Ready Salted crisps…
Quenching that thirst with a refreshing pint.
I can taste the cool beer on my lips now.
Watching as the drops of condensation run down the side of the glass.
But what’s that? I open up my bag of crisps, and there are only 2 crisps in there… Shi*t I have been had over here!
Pub visit ruined.
So that didn’t actually happen
But only through adequate quality assurance and quality control can these situations be held in the factory, quarantined and actioned.
Think about it:
When you are producing 11 million bags of crisps a day… That’s per DAY; as the Walkers plant in Leicester does (its actually the largest crisp manufacturing plant in the world).
It’s not that inconceivable that a bag could escape severely underweight.
Quality control ensures that all those bags are at the same weight.
Hypothesis choice
In our previous blog post we discussed how we got to the following hypothesis:
Null hypothesis, H0= All bags of crisps weigh > 32.51g
Alternative hypothesis, H1 = Some bags of crisps weigh ≤ 32.51g
It’s now for step 2. Stating the Alpha.
Alpha, α
So we have to determine our alpha- (α); this is our risk name.
We determine alpha by:
- Risk tolerance
- Application
- Industry needs
It’s the max risk threshold percentage of rejection for the null hypothesis expressed as a decimal.
What?
Let me explain in English:
So, remember back to our discussion of the central limit theorem how 99.7% of data is centralised in a normal distribution curve between 3 sigma levels of mean.
Then because of this normal distribution curve, we can work out where data points will lie when using our Z score and table.
We can give a confidence level to our data threshold as a percentage, a normal percentage point (significance level) for α is 95%, so therefore our Alpha (α) is 0.05.
The alpha value also gives us the probability of a type I error. Type I errors occur when we reject a null hypothesis that is actually true.
Don’t worry. It will all come together soon. If you take one thing from the above its:
- α= significance level= 0.05 (commonly used giving us a significance level of 95%)
- Type I error is the max risk threshold for rejection of the null hypothesis
At the end of the hypothesis test, we will have to reject or accept the null hypothesis. The alpha is the threshold (and our confidence level in the result), its usually at 0.05 giving us a 95% significance level, but we can change it, for example:
- We want a 98% significance level. We would reduce this number to 0.02
- 99% significance level 0.01
- 90% significance level 0.1
And so on…
The P-value
The P-value is the probability of obtaining a value for the test statistic that is extreme or more extreme than observed, given that the null hypothesis is true.
If the value is too far from its expected value then the P-value will be very low. This indicates that the null hypothesis is unlikely.
We compare the P-value to the Alpha. Because this is the maximum risk we are willing to take in wrongly rejecting the null hypothesis.
If the P-value≤ alpha- Reject the null hypothesis
If the P-value> alpha- Fail to reject the null hypothesis
Beta β
We spoke about alpha and its association with type I errors, the probability of a type II error is β.
A type II error is where we fail to reject the null hypothesis when it is false.
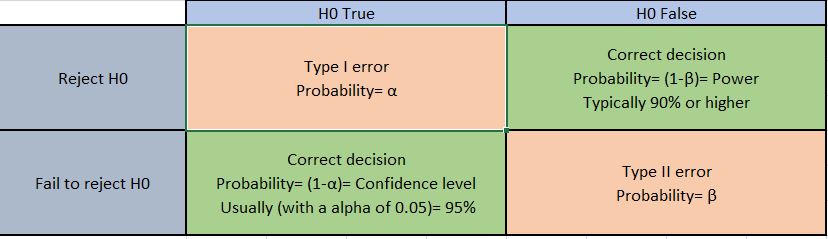
If we have a β of 0.10 (standard level) then Power of the test is 90%. Ideally, we won’t be going below a 90% confidence.
Our crisps example
Step 2 was to ensure that we understood our Alpha level. I hope now when we use the Alpha value in our calculation you understand why we use it, but what number shall we use?
Because we want to ensure that our crisps all have more than 32.51g in each bag and the risk to the company if we don’t have, is high. We will use a confidence interval of 98%, meaning that we will have 98% confidence in our P-value. So our Alpha we are to use is 0.02.
Conclusion
I said before in a previous example of some statistical geekiness not to worry too much about understanding all this information in its entirety. There are some great software tools that do all the above calculations really quickly. Even Microsoft Excel can do these calculations.
If you want any advice on sample testing, or indeed you want us to have a look at any of your samples please get in touch here, or connect with us on LinkedIn here and follow Merchsprout here.